
Public safety became the focal point and key issue for many voters.
COVID-19 Exposure Locations in British Columbia
Parties and social gatherings are fuelling a coronavirus comeback.

During COVID-19 pandemic data viz are a digital standout in a global health crisis
(Photo: NEWSIS/Associated Press) “Flatten the curve” became the slogan for the crisis thanks to an overlapping area graph. Covid-19 Data Viz
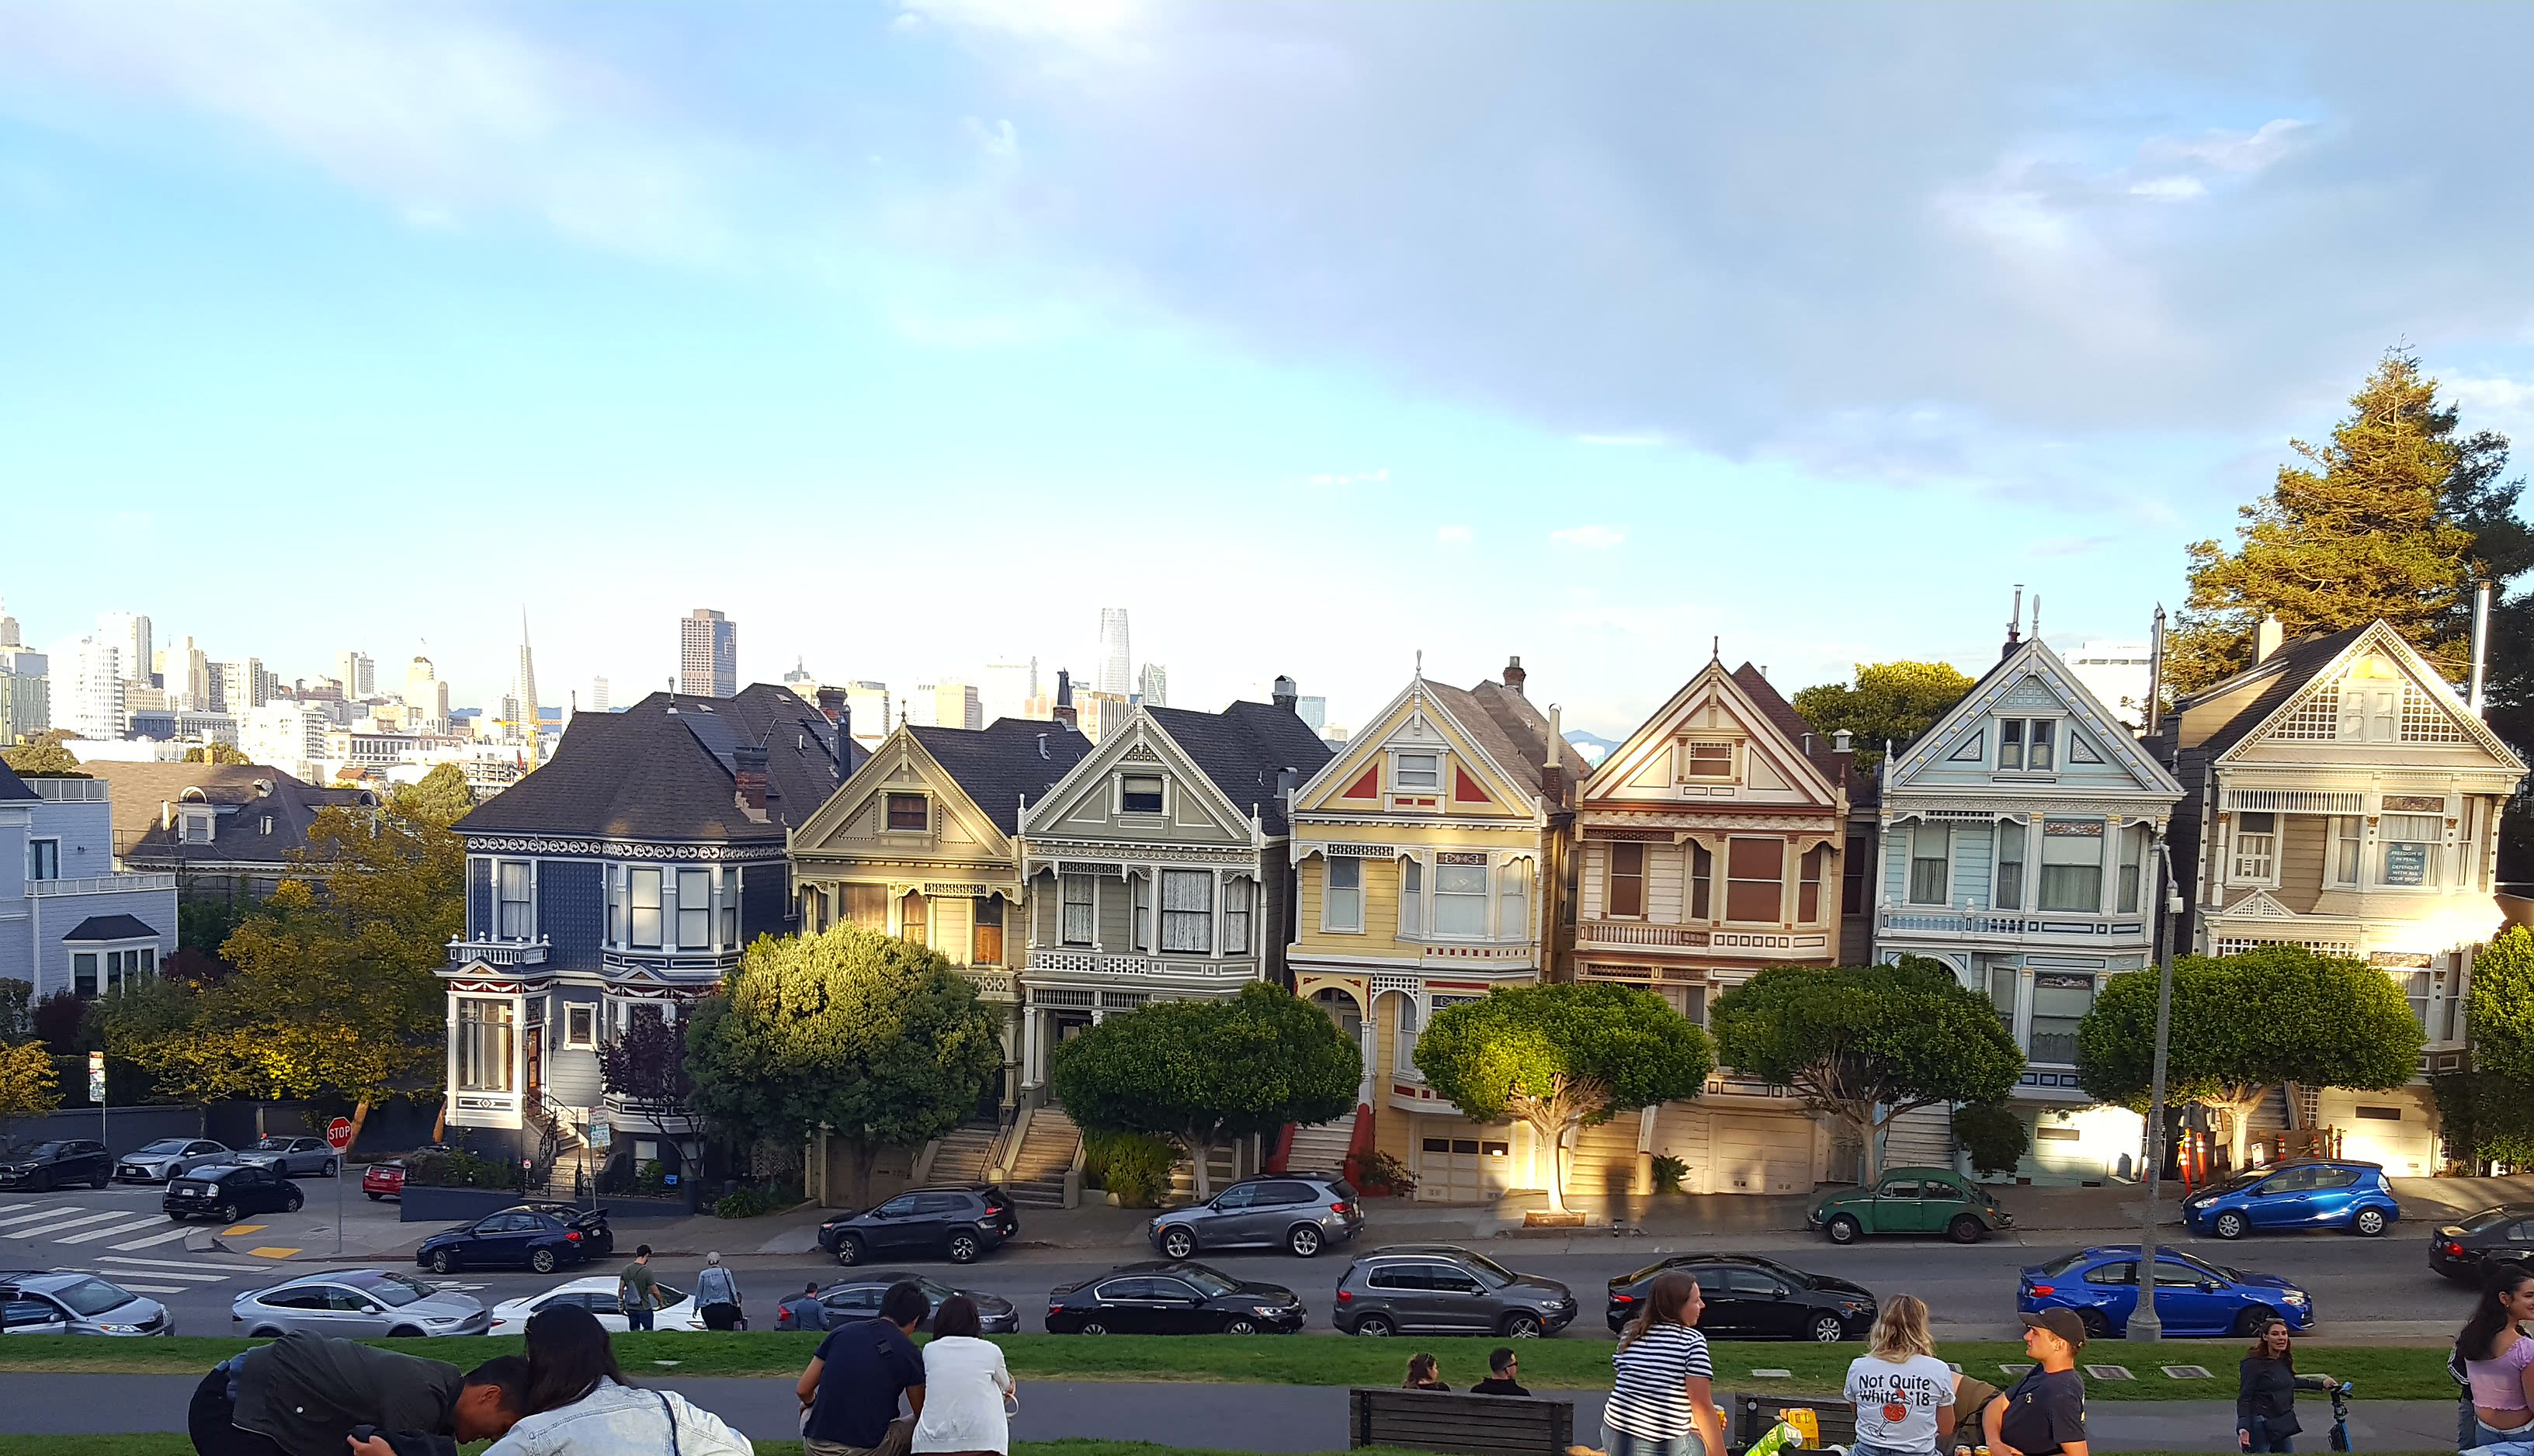
San Francisco 2019: An interactive map of one of America’s most expensive cities
Eight places to see when visiting San Francisco. Because living there will break your bank.

The three million tweets that tried to sway an election
(Photo: Reuters) An army of Russian bots and Twitter trolls launched a concerted effort to spread misinformation and discord on the internet.

This is what Twitter traffic looks like
(Photo: Wired) Here’s what a month’s worth of Twitter data looks like when visualized.